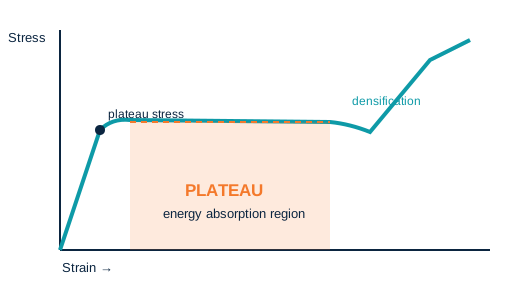
The single most useful graph for an engineer specifying aluminum foam as an absorber is the compressive stress–strain curve. It explains both why the material works and how to specify it.
Three regions of the compression curve
Under quasi-static compression a closed-cell foam typically shows: (1) a short elastic region where cell walls bend; (2) a long, roughly flat plateau region where cells collapse layer by layer at nearly constant stress; and (3) a densification region where most cells have collapsed and stress rises steeply. The area under the plateau is the energy absorbed per unit volume. A long, flat plateau means a large amount of energy is dissipated at a controlled, limited force — exactly what a crash absorber or protective structure needs.
The numbers that matter
| Parameter | Meaning | Typical published range* |
|---|---|---|
| Plateau stress | Average compressive stress in the plateau region | roughly 1–30 MPa, strongly density-dependent |
| Densification strain | Strain at which the plateau ends | roughly 0.4–0.8 |
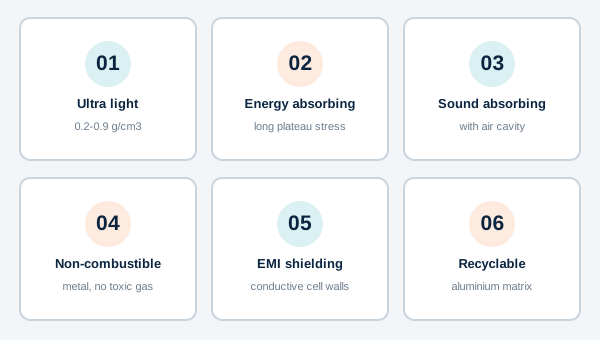
| Apparent density | Mass per unit volume of the foam | roughly 0.2–0.9 g/cm3 |
| Specific energy absorption | Absorbed energy per unit mass | rises with plateau stress and usable stroke |
*Indicative ranges across the open literature, not guaranteed values. They must be tied to a specific alloy, density, cell size, specimen geometry and test method.
Why relative density dominates
In the Gibson–Ashby framework for cellular solids, stiffness and strength scale as a power of relative density (ρ*/ρs), commonly with exponents around 1.5–2 for plateau stress. That means a modest increase in density produces a large increase in plateau stress — and also in total absorbed energy. Design is therefore a trade-off: the lightest possible foam may be too weak to absorb the required energy, while an over-dense foam transmits too much force. State the allowable force and the available crush distance first, then choose the density.
Strain rate and small-cell foam
At higher strain rates, measured energy absorption can differ from quasi-static results; published comparisons report increases in a broad band depending on alloy and structure. Dynamic qualification should therefore be tested at the relevant impact velocity rather than extrapolated from a static curve. Reducing average cell size and narrowing the pore-size distribution is one of the routes used to improve mechanical performance — our R&D cooperation includes small-cell foam with an average pore diameter of about 1–2 mm.
How to specify it
Ask for a compression curve to ISO 13314 (Mechanical testing of metals — compression test for porous and cellular metals) at the density you intend to purchase, together with density tolerance and cell-size distribution for the batch. For dynamic applications add impact tests at the relevant velocity. A single "compressive strength" number is not enough to select an absorber.
Key takeaways
- Energy absorption comes from progressive cell collapse at near-constant stress.
- Plateau stress scales strongly with relative density.
- Densification strain limits the usable crush stroke.
- Request the full ISO 13314 curve at the purchased density.